Safe Work Australia has revealed preliminary data on which industries have been the most dangerous so far this year
From 1 January to 7 July, a total of 81 workers have been killed, according to preliminary figures from Safe Work Australia.
Breaking this down the five industries with the highest fatalities so far this year are below (with number of fatalities listed in parentheses):
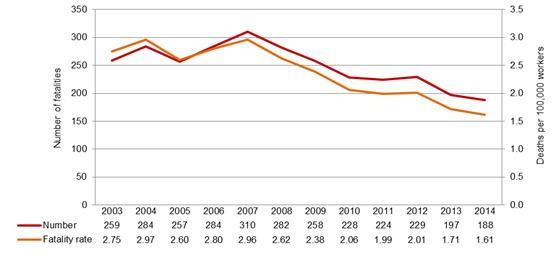
While these are merely initial figures, trends in the latest agency report released last year have found that both the rate and number of work-related fatalities have been declining over time, a spokesperson said.
“Between 2003 and 2014, the rate of work-related injury fatalities fell by 41% from 2.75 fatalities per 100,000 workers in 2003 to 1.61 in 2014. Over the same period, the number of worker fatalities fell by 27% from 259 to 188.”

Source: Work-related Traumatic Injury Fatalities Report, 2014
While reducing fatalities, injuries and illness is an organisation-wide goal, HR practitioners can help improve performance by making senior managers and supervisors aware of ‘lag indicators,’ the spokesperson said.
“Noting that for every injury and fatality there are usually hundreds of near misses, near miss data and incident reports should also be analysed and discussed with senior management so they can take action to respond and prevent fatalities.”
A comparison of work health and safety profiles against other firms of the same size and industry can also be a good way to address associated risks they said.
“HR professionals should also source accurate information about the true costs of work-related deaths and injuries, and the benefits that avoiding those costs and improving work design can bring to business productivity.”
Final figures for 2015 worker fatalities are currently being verified, they said, with the next edition of the Work-related Traumatic Injury Fatalities Report to be released soon.
From the last edition of the report, the worst five industries for workplace fatalities for 2014 in Australia are listed below:
| Industry | Number | Rate (per 100,000 workers) |
| Transport, postal and warehousing | 46 | 7.71 |
| Agriculture, forestry and fishing | 43 | 13.25 |
| Construction | 31 | 2.98 |
| Manufacturing | 15 | 1.62 |
| Arts and recreation services | 10 | 4.75 |
| Mining | 10 | 3.99 |